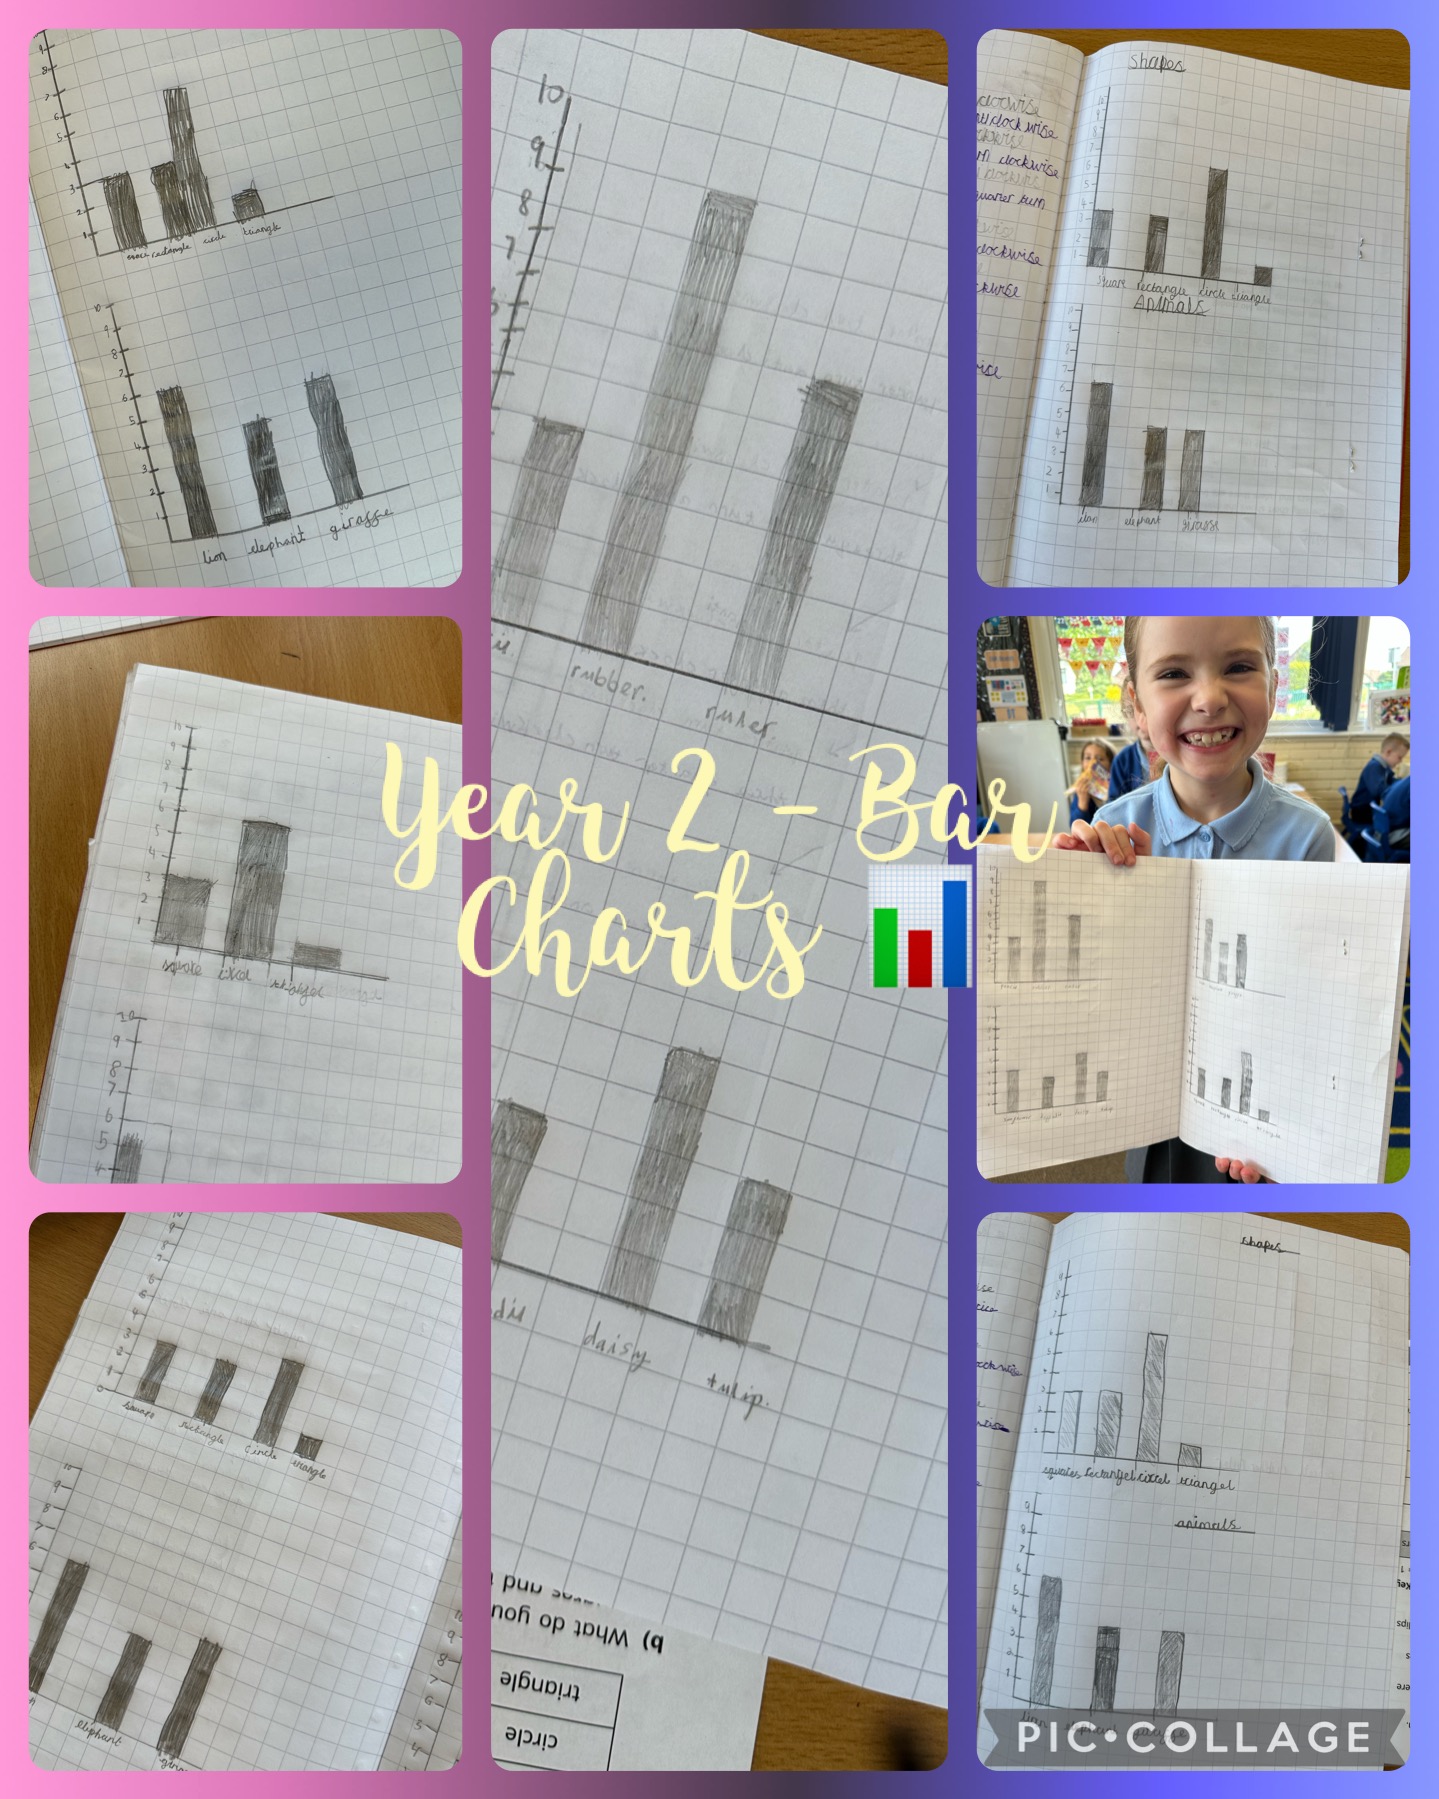
During our statistics unit, Year 2 have been focusing on a variety of ways to display and represent findings. We have looked at tally charts, pictograms and now we have been focusing on bar charts. The children worked really hard to display their findings in a presentable way.