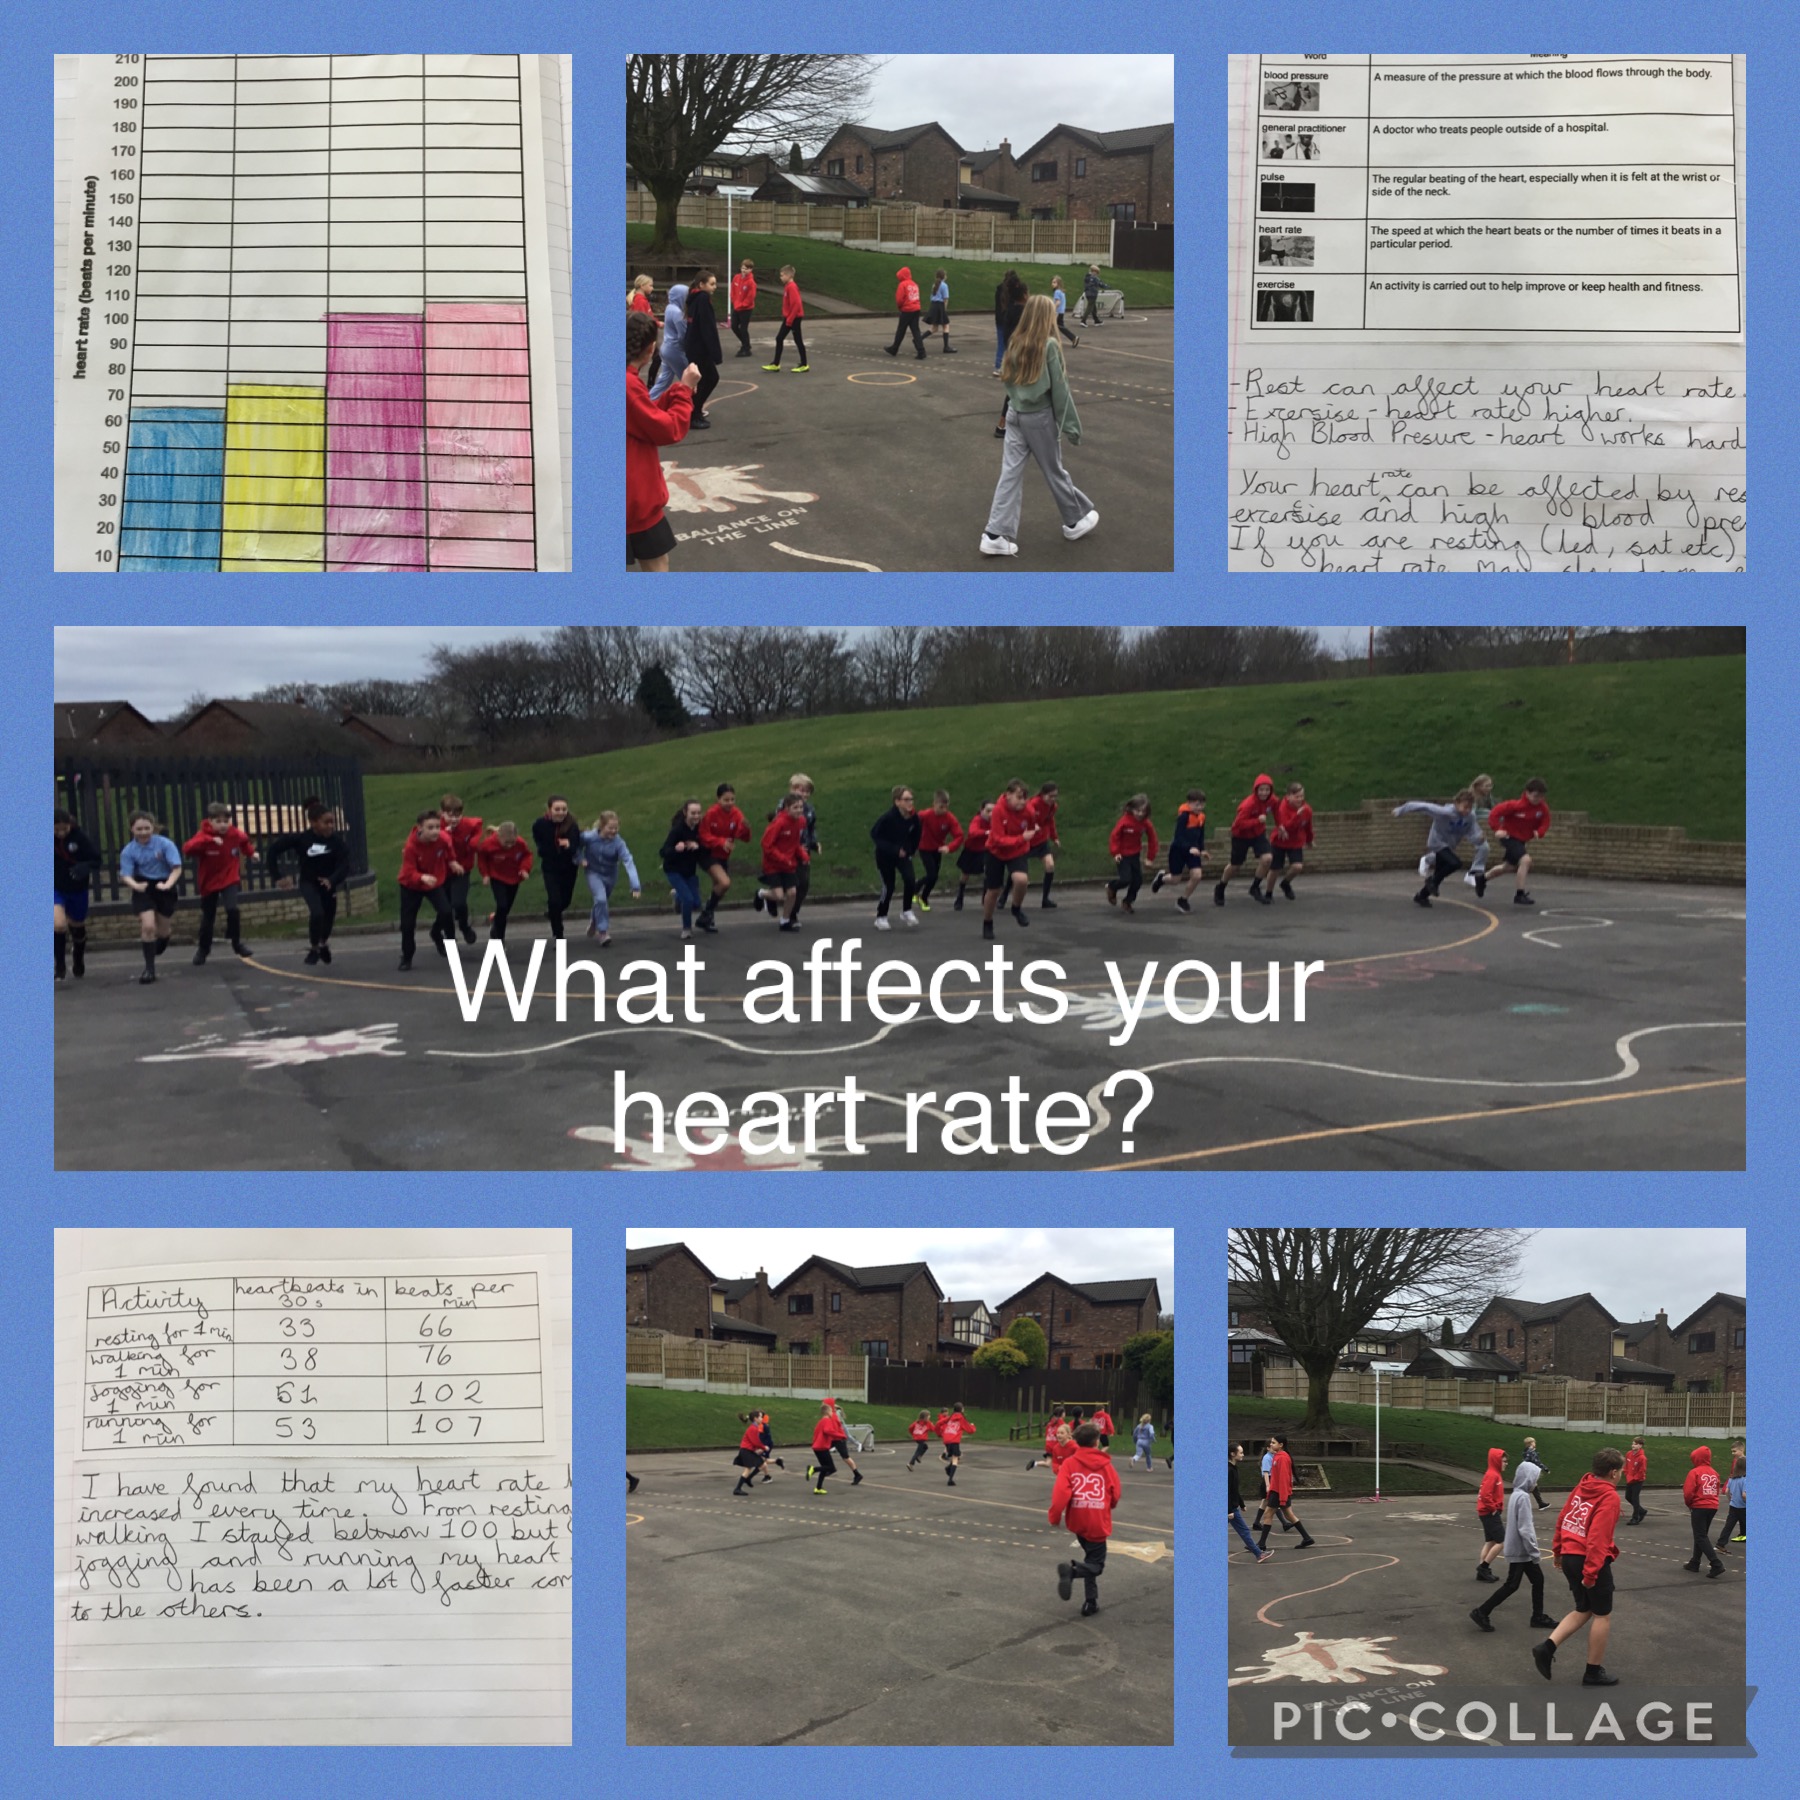
Year 6 investigated what happens to their heart rate as the intensity of an activity increases. They then used their results and presented them in a bar chart so that the data can be interpreted easily.
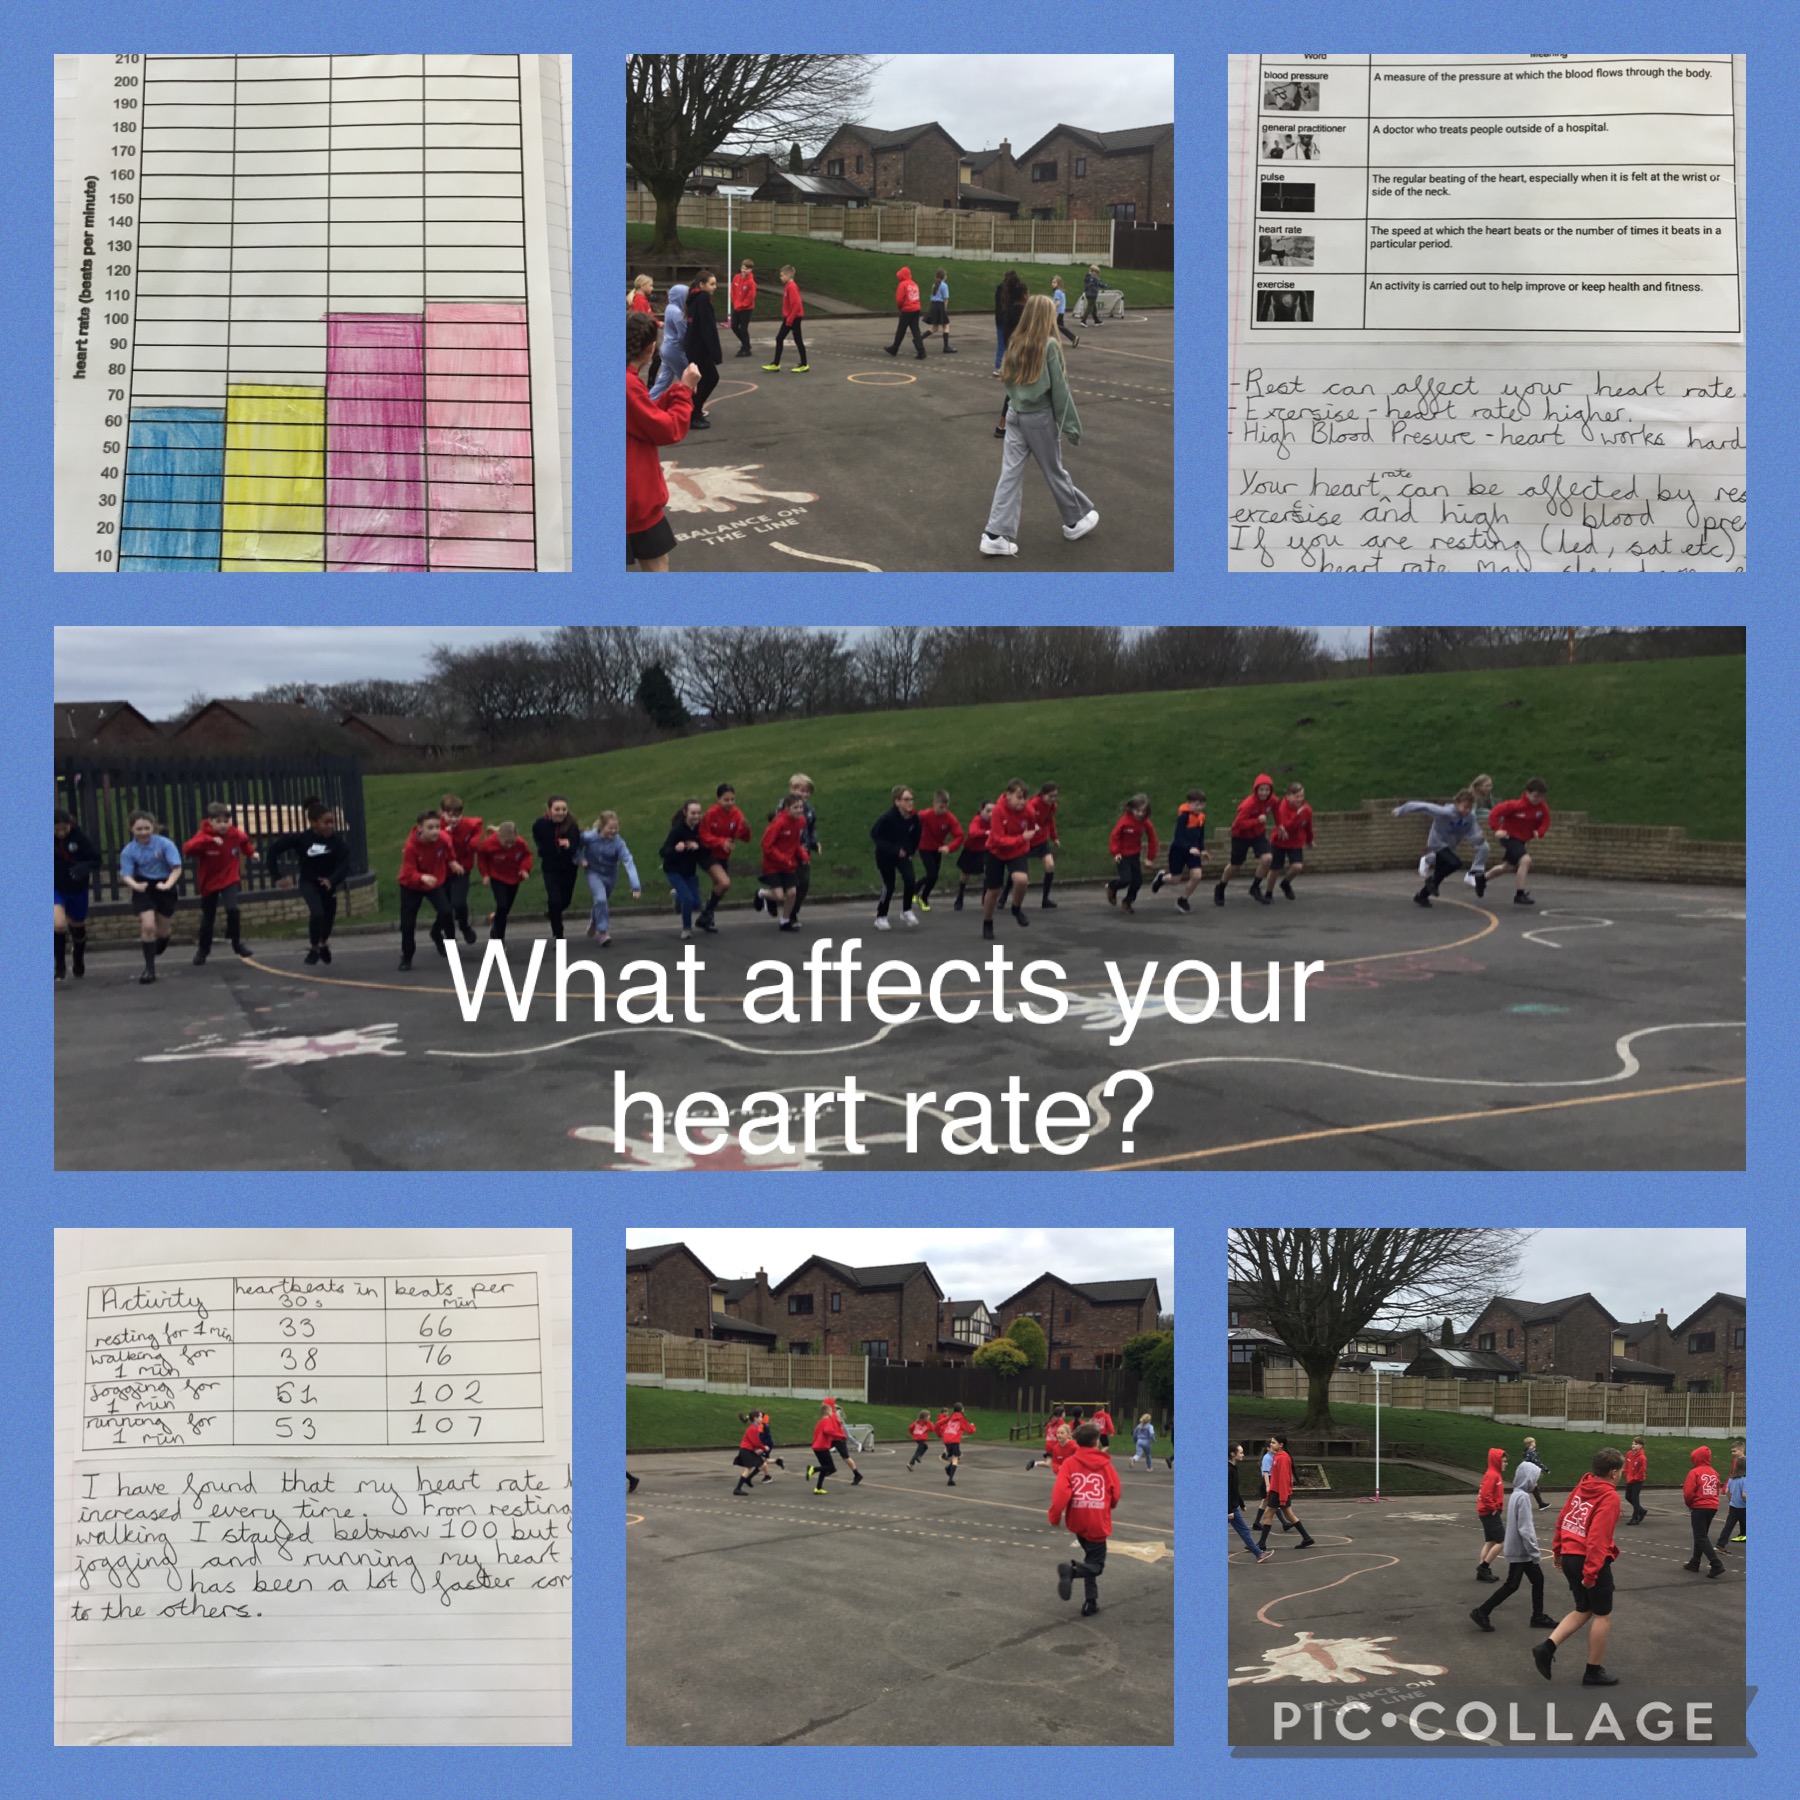
Year 6 investigated what happens to their heart rate as the intensity of an activity increases. They then used their results and presented them in a bar chart so that the data can be interpreted easily.
.png)